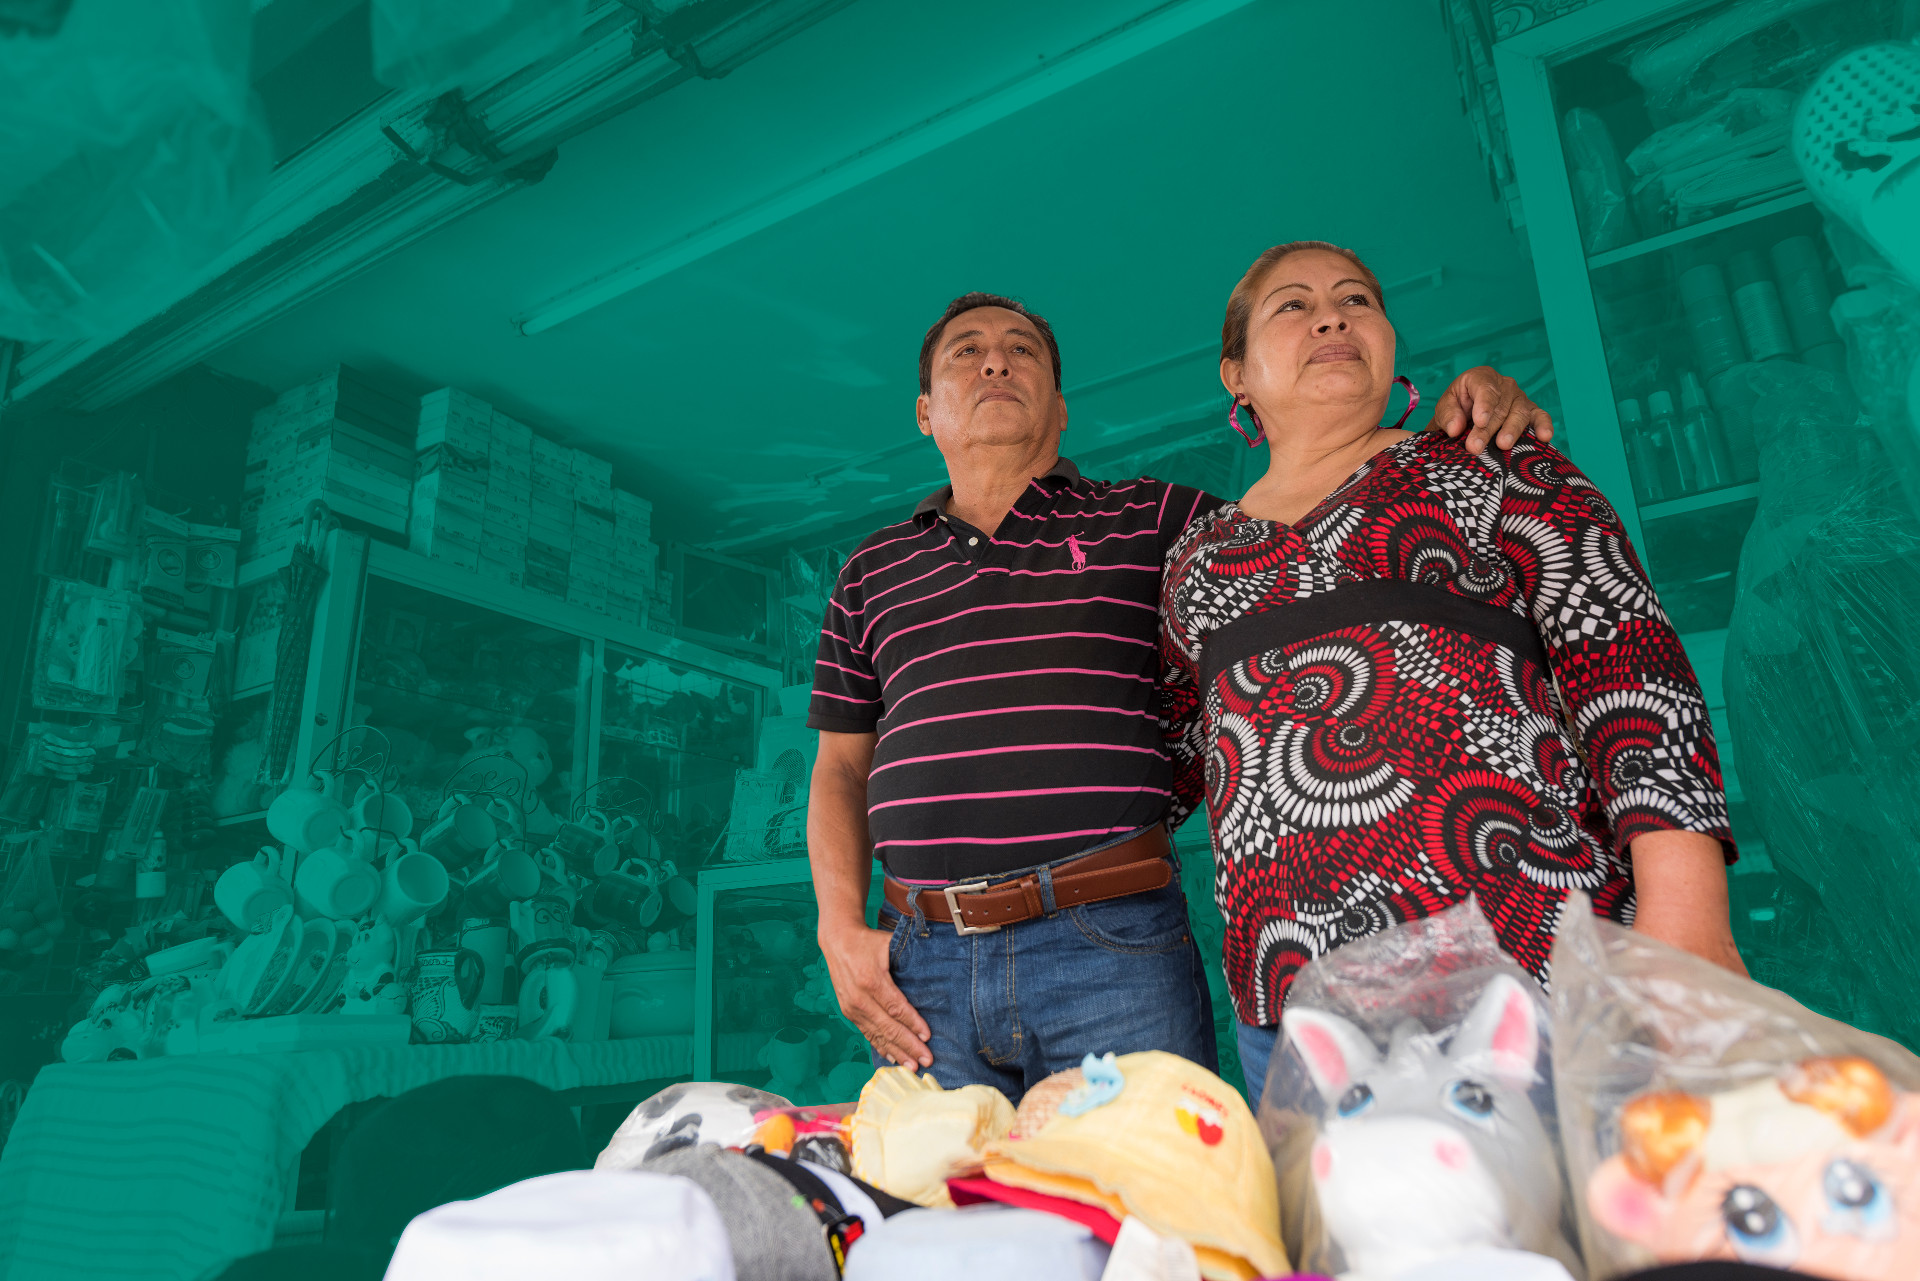
Generation ofEconomic Value
G4-EC8
Generation ofEconomic ValueG4-EC8
We build innovative, efficient and profitable commercial models.
|
Indicators
|
2014
|
2015
|
Variation
|
|---|---|---|---|
| Total portfolio (million pesos) | 23,951 | 28,496 | 19.0% |
| Net result | 3,162 | 3,161 | 0.0% |
| Operating efficiency | 27.6% | 30.00% | 2.4 pp |
| Direct employment | 18,999 | 20,179 | 6.2% |
| Indirect employment(1) | 2’883,686 | 3’218,117 | 11.6% |
(1)Number of clients at the end of the period multiplied by 1.0032 persons hired by microbusinesses, according to a national survey of microbusinesses conducted by the INEGI in 2010.
Financial performance
G4-DMA ECONOMIC PERFORMANCESince the Group leads in financial services for the bottom of the pyramid, and in compliance with our work to eradicate financial exclusion, we are responsible for generating constant and transparent results in order to allow our stakeholders to make better decisions.
G4-2, G4-14Even at the risk of an increase in the default rate, in the costs of services denominated in U.S. currency, in funding costs and in the probability that some of our clients decide not to take on more credits, and together with the microeconomic and the macroeconomic context, our outstanding financial
performance brings with it positive impacts that allow our permanence as the driving group of the economy; the one providing the greatest number of people with service point infrastructure, new products and services, and job creation, in addition to the consolidation of the relationship with our funders –the commercial banks, development banks and the debt market.
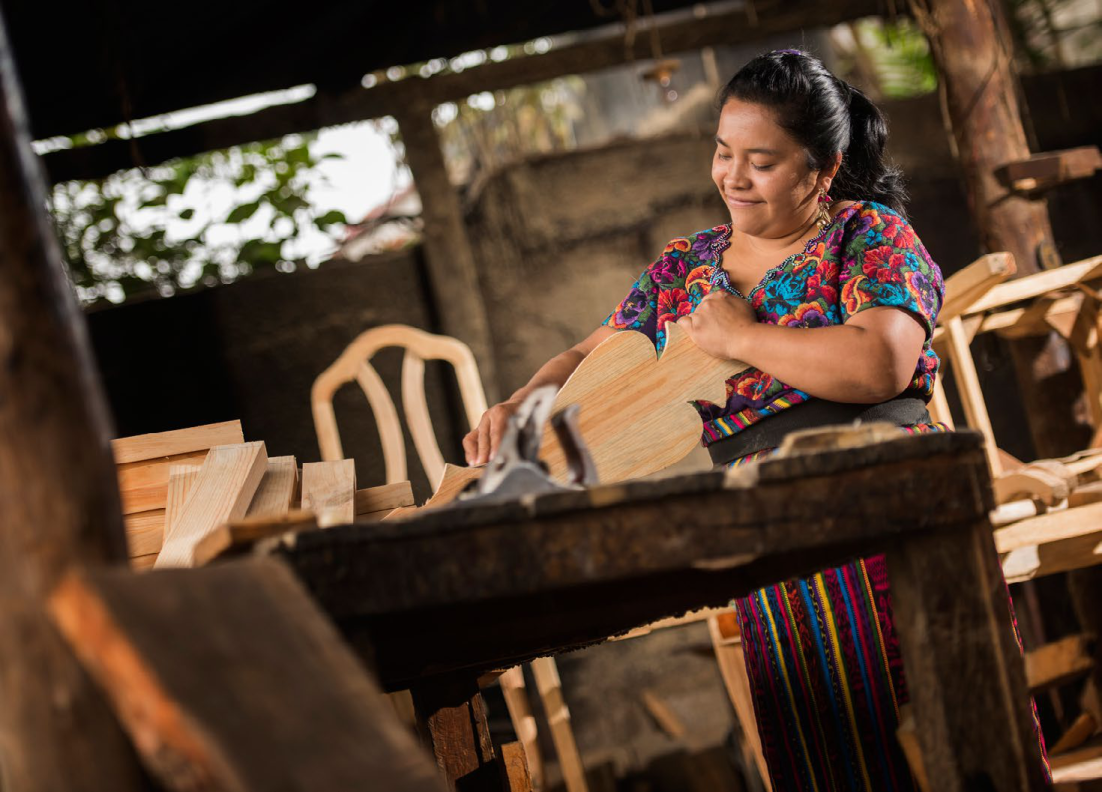
We have put in place performance control processes whose objective is to maximize the positive impacts and identify possible risks, as well as to mitigate the negative impacts of the results of Gentera and its companies.
In order to manage such impacts, allow compliance of the established goals, facilitate possible deviations in the approved business plan and inform our stakeholders about these processes and results, we use the following tools:
- Monthly financial statements of all Group companies
- Monthly financial analysis
- Permanent contact with the Equity and Debt markets
- Annual Business Plan and Budget
- Board of Directors Committees which advise management as to the best practices in the industry and other countries
- Management indicators and control boards that report to the Committees and to the Board of Directors
- Reports to external entities –CNBV, BMV, SBS, rating agencies, analysts, funders, authorities and regulators–
- Report of relevant events
- Monitoring of the budget control process
Assets and capacities
In conformity with these action lines, in 2015 we achieved:
- More than 3.2 million clients, increase of 333,364 clients with respect to 2014
- A portfolio of 28,496 million pesos, representing an increase of 19% with respect to 2014
- The addition of remittances to our service offer, through the acquisition of Intermex
- The acquisition of 99.99% of the stock of Compartamos Financiera in Peru
- The first issuance of debt in the Peruvian stock market
- Implementation of the new corporate ERP (SAP) in Gentera
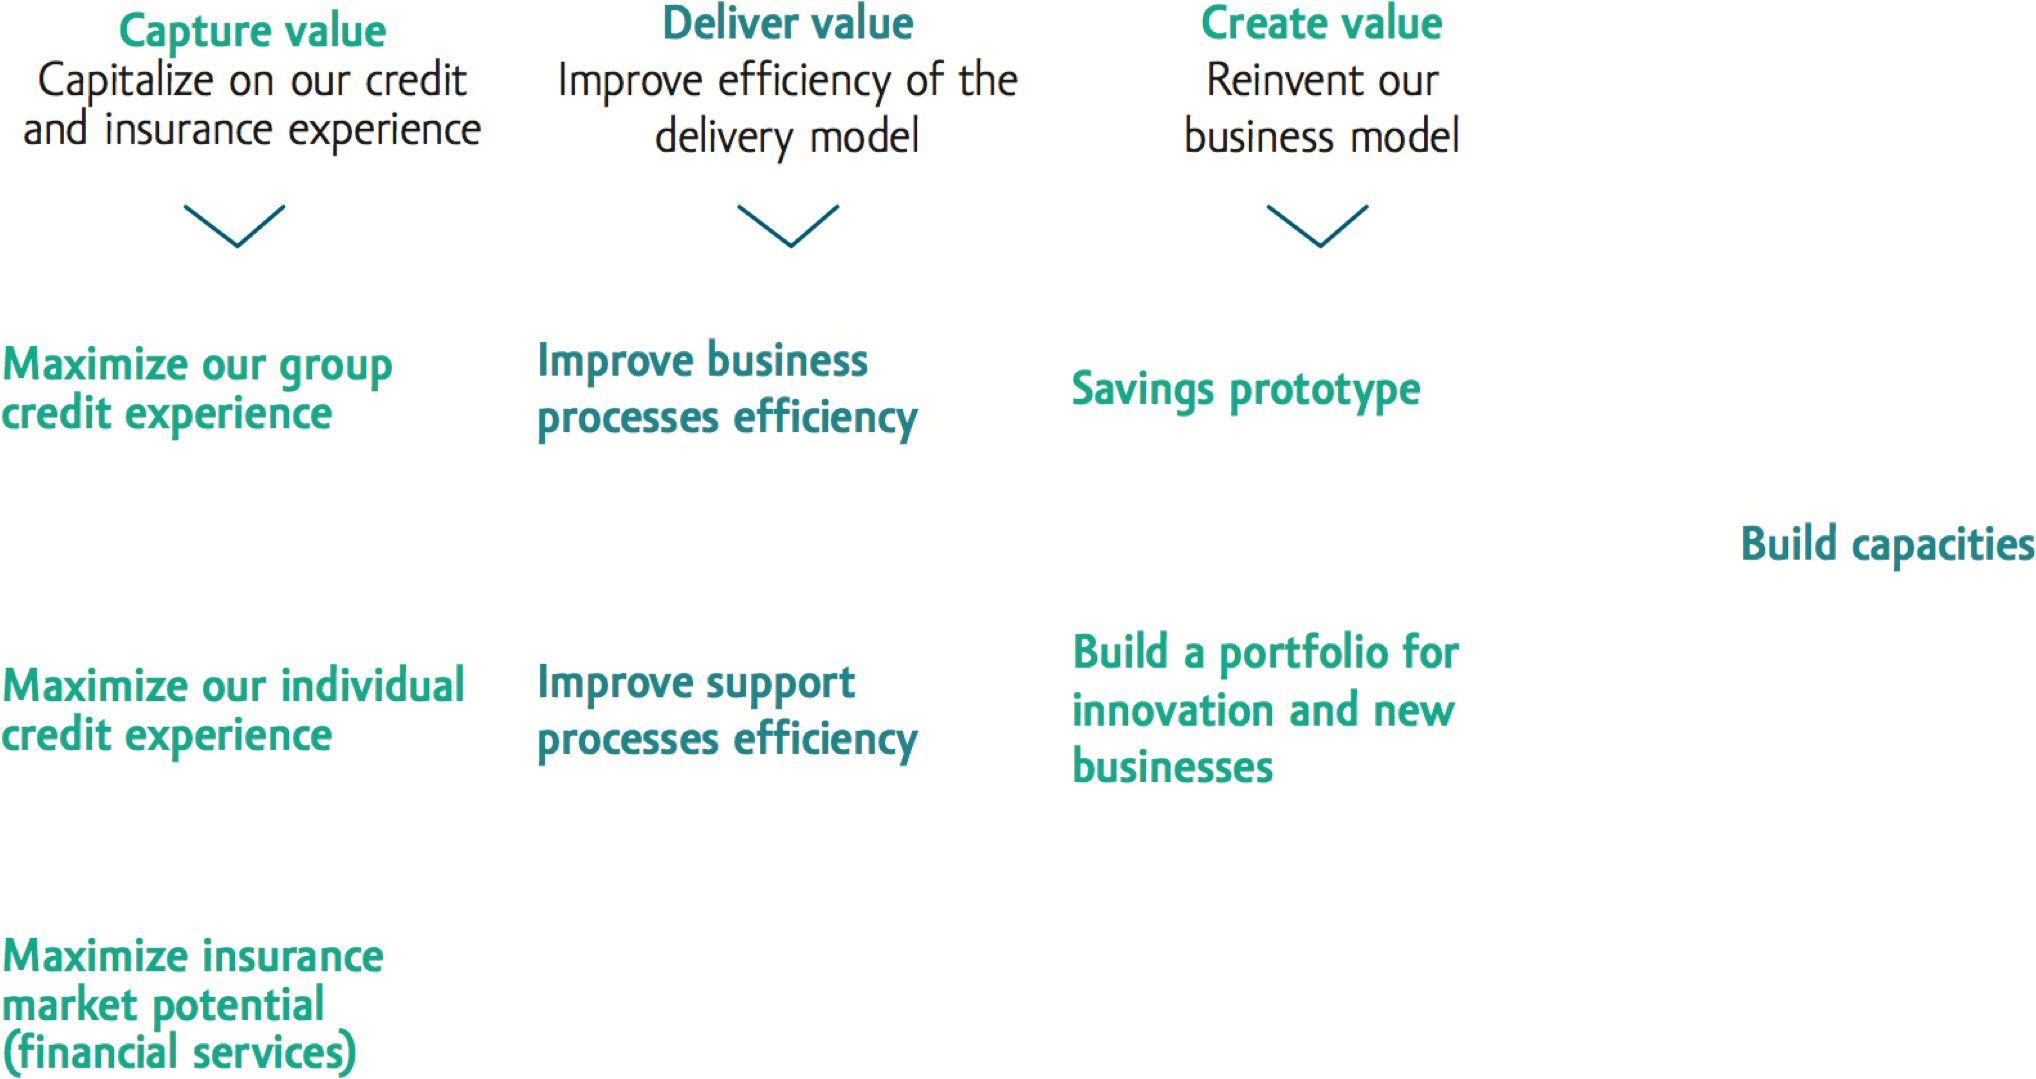
As part of our strategic renovation, we have redefined our aspirations: we aspire to empower ten million people of the under-attended segment in the next ten years, in order to improve their life through personalized digital financial solutions and generate shared value.
To achieve our aspiration, we have outlined our strategic route for the next five years; with it we intend to grow through geographical, client and financial solution diversification, bolstering the relationship with our clients and operating efficiently.
19%
PORTFOLIO INCREASE
3,161
MILLION PESOS
NET PROFIT
3.09%
OVERDUE PORTFOLIO
ROA
9.3%
ROE
25.1%

2016 GOALS
- Increase portfolio
- Increase financial margin
- Reach more clients
- Maintain rates
- Streamline expenses
| Concept | 2013 | 2014 | 2015 |
% variation 15/14 |
|---|---|---|---|---|
| Clients | 2’754,860 | 2’874,488 | 3’207,852 | 11.6% |
| Employees | 19,339 | 18,999 | 20,179 | 6.2% |
| Branches(1) | 577 | 635 | 758 | 19.4% |
| Portfolio (million pesos) | 20,706 | 23,951 | 28,496 | 19.0% |
| Average Loan per Client | 7,516 | 8,332 | 8,883 | 6.6% |
| Non-performing loans | 3.12% | 3.28% | 3.09% | -19.0 pp |
| (Million pesos) | ||||
| Credit portfolio interest | 12,475 | 14,348 | 17,167 | 19.6% |
| Revenue from financial investments(2) | 115 | 103 | 109 | 5.8% |
|
Revenue from asset sales (tangible and intangibles) |
-39 | 7 | -15 | -314.3% |
| Interest revenue | 12,590 | 14,451 | 17,276 | 19.5% |
| Interest expenditures | 818 | 822 | 885 | 7.7% |
| Financial margin | 11,772 | 13,629 | 16,391 | 20.3% |
| Risk adjusted financial margin | 10,164 | 11,937 | 14,185 | 18.8% |
| Operating expenditures | 6,763 | 7,939 | 10,156 | 27.9% |
| Salaries and benefits(3) | 4,328 | 4,905 | 6,030 | 22.9% |
| Taxes(4) | 1,241 | 981 | 1,445 | 47.3% |
| Community investments (million pesos) | ||||
| Monetary donations + in kind (FRSC) | 29.4 | 32.1 | 36.7 | 14.3% |
| Contributions one on one (Call for Education) | N/A | N/A | 5.7(5) | |
| Volunteering (Foundation) | 0.4 | 0.9 | 2.7 | 200.0% |
| Services or equipment contributions in kind | 3.6 | 2.8 | 6.8 | 142.9% |
| Donation, volunteering and community programs (FRSC) management | 1.4 | 0.8 | 0.5 | -37.5% |
| Costs and investments for environmental care (million pesos) | ||||
| Prevention and environmental management costs | 0.8 | 1.3 | 1.6 | 23.1% |
| (Million pesos) | ||||
| Operating results | 3,512 | 4,147 | 4,658 | 13.0% |
| Net result | 2,271 | 3,162 | 3,161 | 0.0% |
| Capitalization (by terms of debt) | 15,222 | 16,083 | 21,142 | 31.5% |
| Capitalization (by terms of net equity) | 8,943 | 12,060 | 13,501 | 11.9% |
| Average portfolio | 20,359 | 22,801 | 26,460 | 16.0% |
| Average earning assets | 22,399 | 25,442 | 29,110 | 14.4% |
| Operating results/average portfolio | 17.3% | 18.2% | 17.6% | -0.60 pp |
| Net result/average portfolio | 11.2% | 13.9% | 11.9% | -2.00 pp |
| Operating result/average earning assets | 15.7% | 16.3% | 16.0% | -0.30 pp |
| Net result/average earning assets | 10.1% | 12.4% | 10.9% | -1.50 pp |
| Asset | ||||
| Availability + Security investments + repurchase debtors | 2,533 | 3,363 | 3,539 | 5.2% |
| Asset | 25,362 | 30,543 | 36,514 | 19.5% |
| Liquidity (availability + security investments) / total asset | 10.0% | 11.0% | 9.7% | -1.30 pp |
| Total portfolio | 20,706 | 23,951 | 28,496 | 19.0% |
| Overdue portfolio | 645 | 785 | 881 | 12.2% |
| Fixed asset | 976 | 921 | 1,087 | 18.0% |
| Liability | ||||
| Total liability | 16,419 | 18,483 | 23,014 | 24.5% |
| Debt at cost | 15,222 | 16,083 | 21,142 | 31.5% |
| Equity | 8,943 | 12,060 | 13,501 | 11.9% |
| Earnings per share (pesos) | 1.38 | 1.90 | 1.93 | 1.6% |
| Average assets | 25,025 | 28,726 | 33,855 | 17.9% |
| Average stockholders’ equity | 8,977 | 10,758 | 12,587 | 17.0% |
| ROA (net result/average assets) | 9.1% | 11.0% | 9.3% | -1.70 pp |
| ROE (net result/average stockholders’ equity) | 25.3% | 29.4% | 25.1% | -4.30 pp |
| Book value per share (pesos) | 5.4 | 7.3 | 8.2 | 12.3% |
| Share value by end of year (pesos) | 24.4 | 29.7 | 33.35 | 12.5% |
| Total shares for UPA and PCA calculation | 1,648’211,536 | 1,648’211,536 | 1,638’682,719 | -0.6% |
(1) Includes Mexico, Peru and Guatemala, and 60 Intermex branches and 11 branches of Compartamos Banco.
(2) Figures for interest on financial loans, shareholding dividends, royalties and direct revenue from assets.
(3) Includes salaries, bonuses, benefits and transportation bonus (fare for sales force).
(4) Income tax payable and deferred.
(5) In 2013 and 2014 we did not have one on one contributions. Base line for this indicator is 2015.
| Share value | 2013 | 2014 | 2015 | COMPRAR C / Gentera share variation | ||
| Pesos | % | USD | ||||
| Share value on last working day of year | 24.4 | 29.7 | 33.4 | 3.7 | 12.5% | 0.2 |
| Exchange rate published on January 4, 2016 in DOF | 13.0843 | 14.7414 | 17.2487 | |||
| Share amount | 1,648’211,536 | 1,648’211,536 | 1,638’682,719 | |||
| Number of effective shareholders | 5 | 5 | 3 | |||
|
Credit portfolio (million pesos) |
2013 | 2014 | 2015 |
| Mexico | 16,447 | 18,961 | 22,850 |
| Peru | 4,045 | 47,683 | 5,237 |
| Guatemala | 189 | 221 | 409 |
| Total* | 20,681 | 23,951 | 28,496 |
*In 2013, unlike the Financial Statements’ portfolio, the credit portfolio does not consider a commercial portfolio loan for 25 million pesos.
| Interest revenue in 2015 | Million pesos | % |
| Mexico | 15,442 | 89.4% |
| Peru | 1,569 | 9.1% |
| Guatemala | 265 | 1.5% |
| Total* | 17,276 | 100.0% |
| Main indicators | Mexico | Peru | Guatemala | |||
| 2015 | ∆ vs 2014 | 2015 | ∆ vs 2014 | 2015 | ∆ vs 2014 | |
| Overdue portfolio / total portfolio | 2.86% | 0.20 pp | 4.18% | -1.47 pp | 2.23% | -2.74 pp |
| Coverage rate | 179.9% | 4.9 pp | 168.2% | 19.6 pp | 182.0% | 64.6 pp |
| ROA | 11.6% | -3.4 pp | 2.9% | -1.5 pp | 3.2% | 3.4 pp |
| ROE | 31.7% | -7.2 pp | 12.5% | -21.2 pp | 4.4% | 4.6 pp |
|
Percentage portfolio by region and/ or business unit |
Compartamos Banco | Yastás | Aterna | Gentera |
Compartamos Financiera |
Compartamos S.A. |
| (Mexico) | (Mexico) | (Mexico) | (Mexico) | (Peru) | (Guatemala) | |
| 80.2% | 0% | 0% | 0% | 18.4% | 1.4% |
| Net Income (million pesos) | |||
| 2013 | 2014 | 2015 | |
|
Mexico (Compartamos Banco) |
2,496 | 3,233 | 3,001 |
| Peru | 76.08 | 205.79 | 149 |
| Guatemala | No profit yet | 0.77 | 15.32 |
| Gentera, S.A.B. and companies | 2,271 | 3,162 | 3,161 |
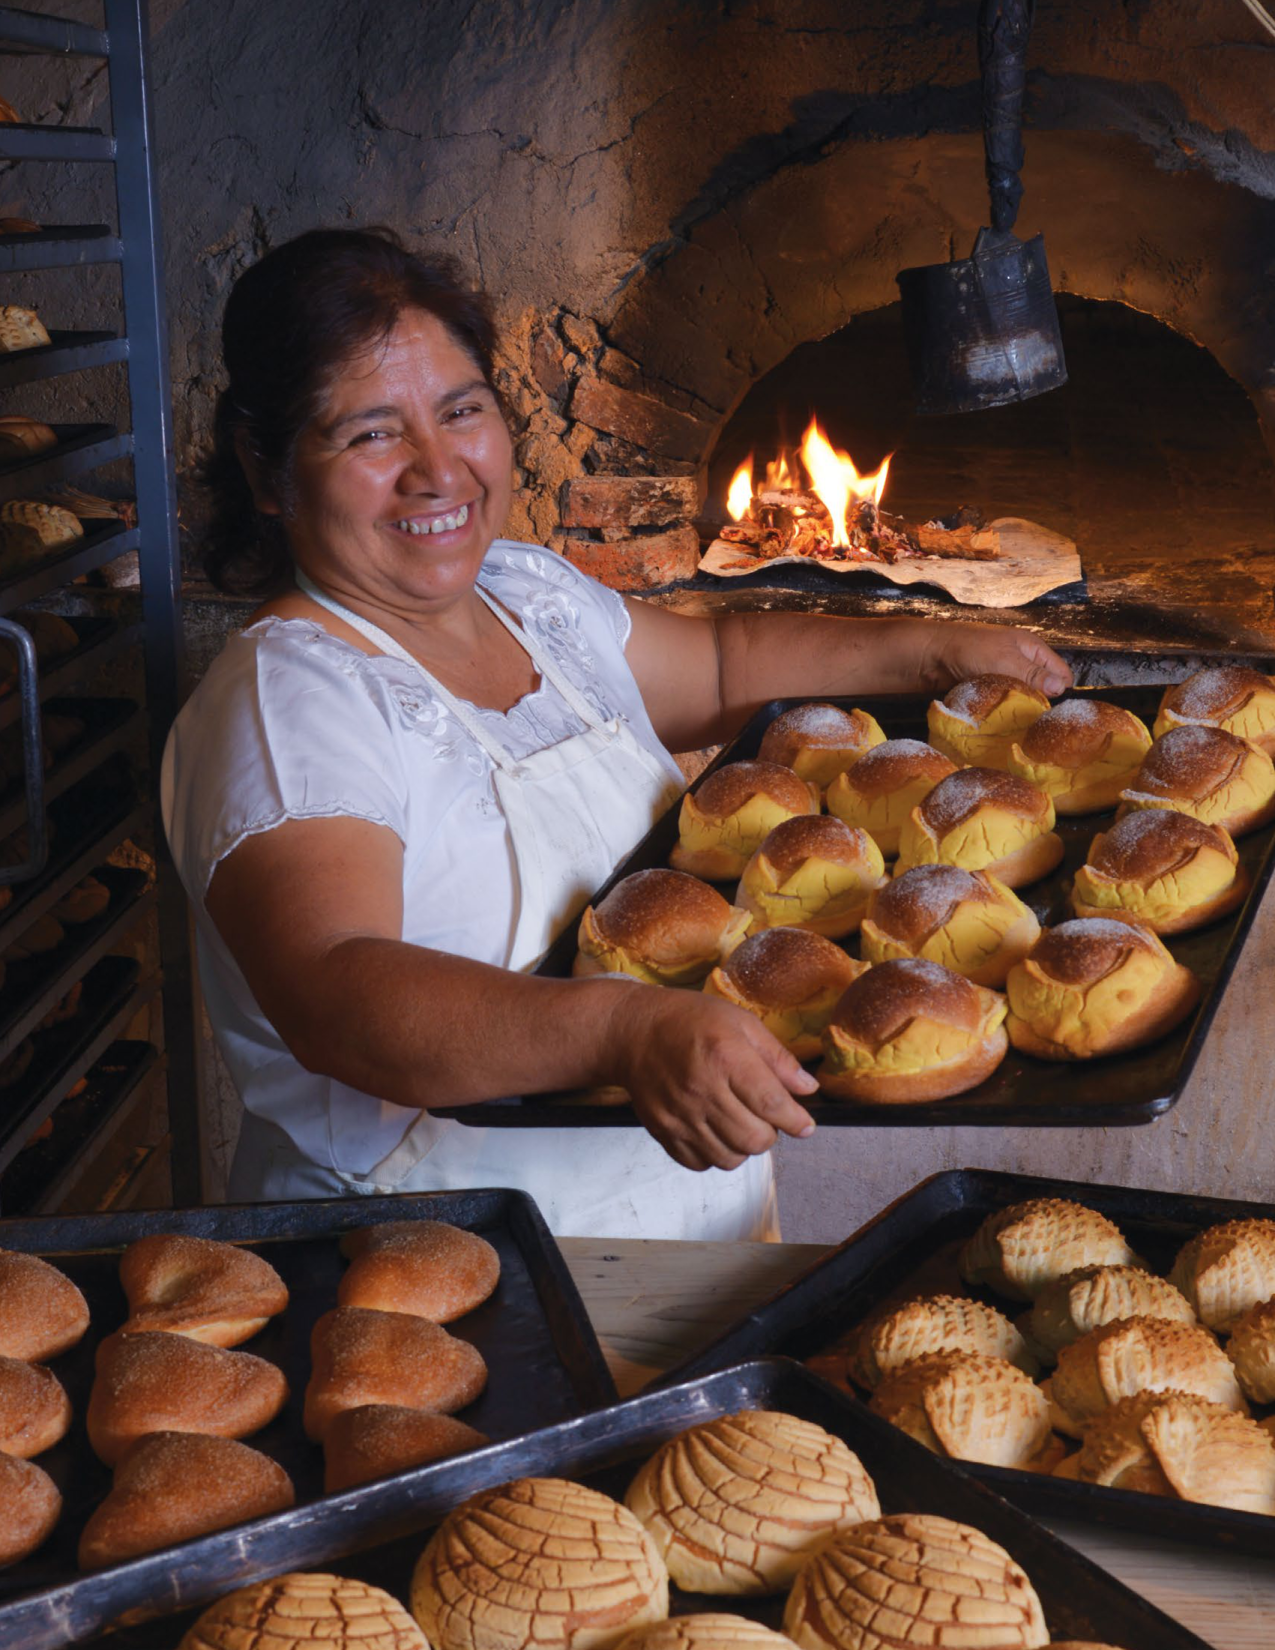
Economic value - created, distributed and retained
|
Concept (million pesos) |
2013 | 2014 | 2015 |
| Created direct economic value(1) | 13,307 | 15,257 | 18,641 |
| Distributed economic value(2) | 9,136 | 10,071 | 12,880 |
| Retained economic value(3) | 4,171 | 5,186 | 5,761 |
| Net result | 2,271 | 3,162 | 3,161 |
(1) Created direct economic value = interest income + commissions and rates paid + intermediation income + other net operating income (expenditures).
(2) Distributed economic value = interest expenditures + commissions and rates paid + management and promotion expenditures + participation in the results of associate + taxes – depreciation and amortization.
(3) Retained economic value = Created direct economic value - Distributed economic value.
| Concept | 2013 | 2014 | 2015 |
| Number of clients | 2’754,860 | 2’874,488 | 3’207,852 |
| Financial margin (million pesos) | 11,772 | 13,629 | 16,391 |
| Operating efficiency | 27.0% | 27.6% | 30.0% |
| Operating results (million pesos) | 3,512 | 4,147 | 4,658 |
|
Net income |
2,271 | 3,162 | 3,161 |
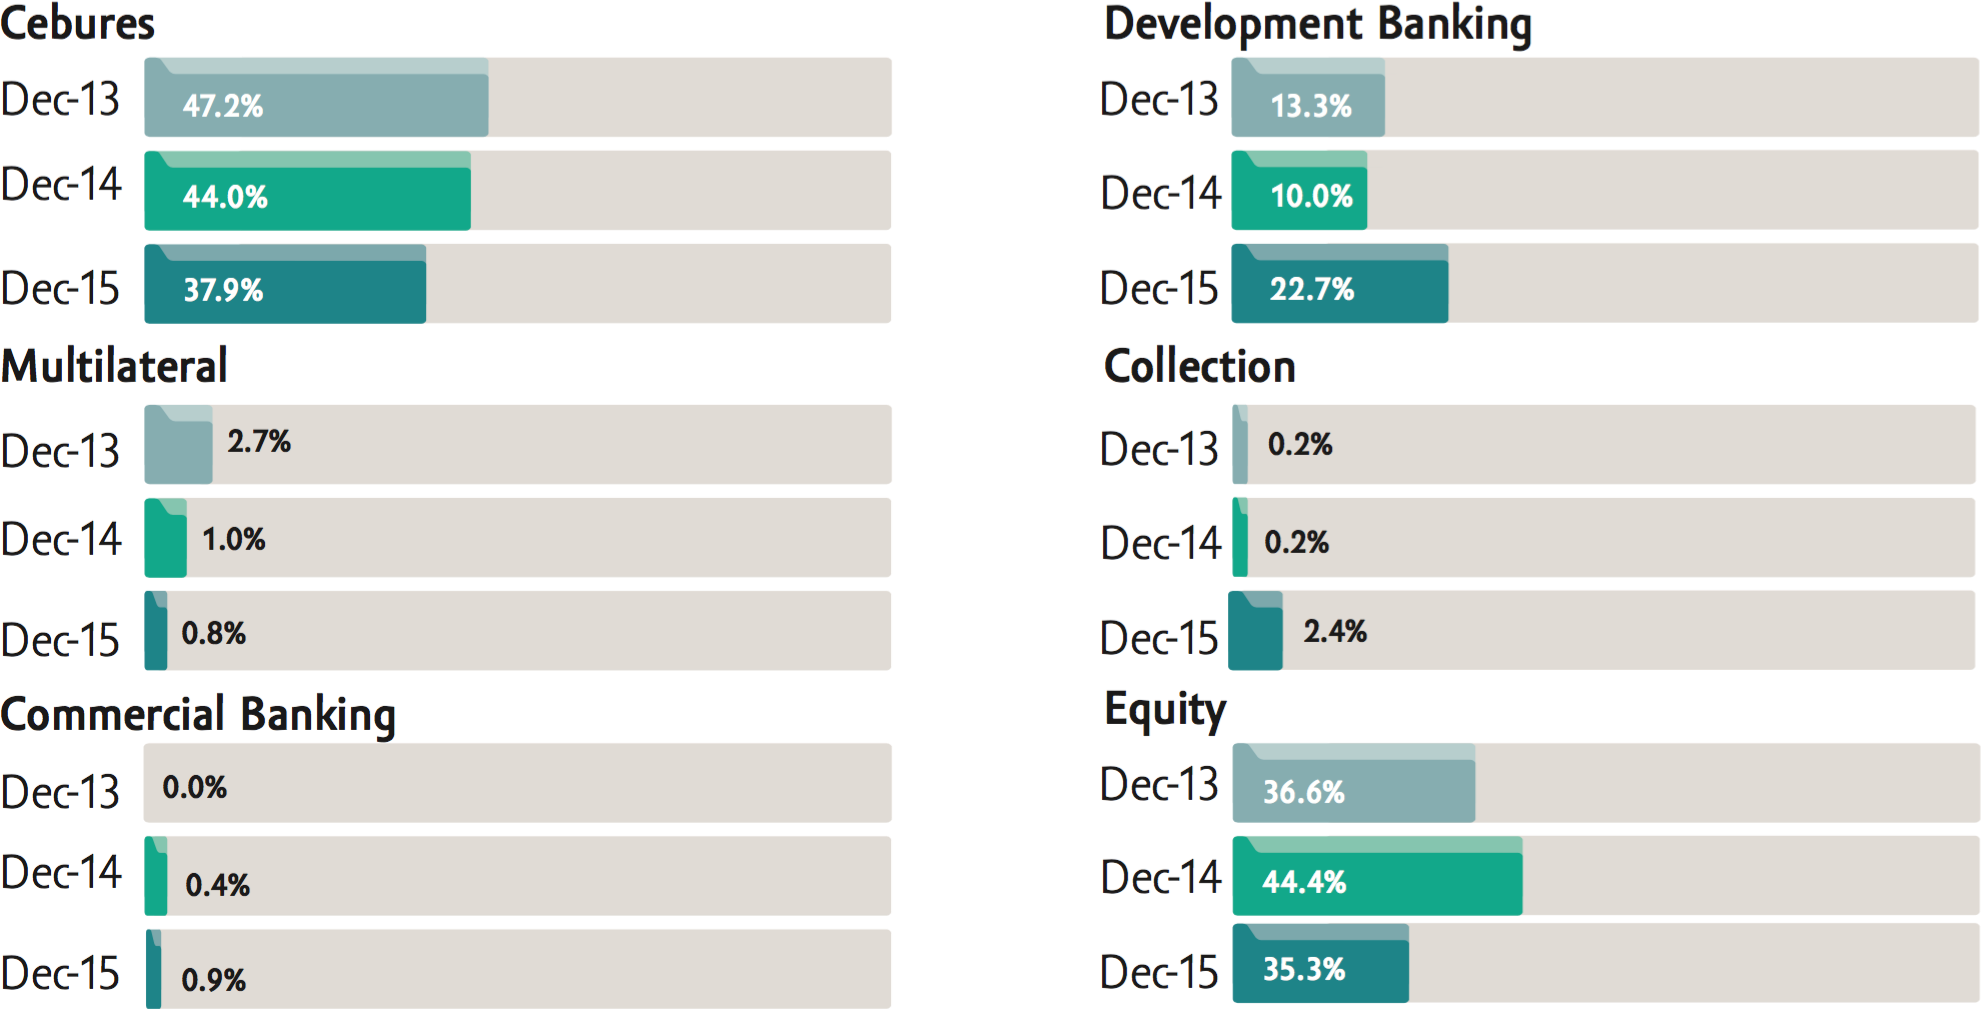
Funding (Compartamos Banco)
|
Compartamos Banco Data |
Equity |
Commercial Banking |
Development Banking |
Multilateral | Cebures | Collection | Total |
| Dec-13 | 36.6% | 0.0% | 13.3% | 2.7% | 47.2% | 0.2% | 100% |
| Dec-14 | 44.4% | 0.4% | 10.0% | 1.0% | 44.0% | 0.2% | 100% |
| Dec-15 | 35.3% | 0.9% | 22.7% | 0.8% | 37.9% | 2.4% | 100% |
| Peru Data(1) | Equity |
Commercial Banking |
Development Banking |
Multilateral |
Investment Funds |
Collection | Total |
| Dec-13 | 11.0% | 10.0% | 30.2% | 3.7% | 29.4% | 15.7% | 100% |
| Dec-14 | 14.2% | 10.6% | 18.8% | 7.9% | 29.6% | 18.9% | 100% |
| Dec-15 | 26.0% | 12.8% | 20.0% | 2.7% | 20.7% | 17.8% | 100% |
(1) In the case of Funding determination in 2013 and 2014, the structure was modified to include Funding Capture.
| Gentera and Mexico Data | 2014 | 2015 | ||
| Banco | Gentera | Banco | Gentera | |
| Accumulated efficiency rate | 63.0% | 65.7% | 68.1% | 68.6% |
| Equity / Total Assets | 41.4% | 39.5% | 34.0% | 37.0% |
| ICAP | 33.1% | N/A | 29.1% | N/A |

